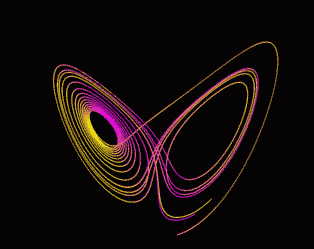
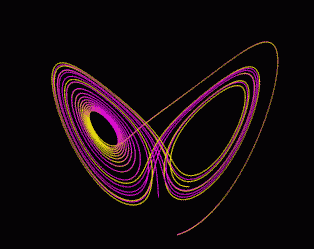
The Lorenz Twins program plots 2 Lorenz graphs (violet and yellow) simultaneously on top of each other. You can slightly alter the initial parameters of one of them and see a demonstration of the famous "butterfly effect". You can enter any numbers you want and get all sorts of crazy graphs, but the three default parameters are 10, 28, and 2.667 (don't ask me why).


The following four programs run in DOS, or a windows command shell, or as I do, from the Linux DOSBOX.
These two plot the Lorenz and Rossler attractors respectively, with user input parameters. However, they also plot an audio graph as well. That means sound !
You can hear the Chaos as well as see it ! A rather strange and unique idea. Try them !
Example outputs of Lorenz and Rossler you can check out.
This program is an updated version [11/21/22] of Lorenz. It plots TWO graphs simultaneously, just like the Lorenz Twins program above.
Only it adds SOUND! It ain't Beethoven, but might pass for House or Techno ...
Example output of Lorenz Twinz you can check out.
This program (primitive but informing) will tell you just how big your pet fractal is. If you are doing deep zooms (any fractal program, doesn't have to be
FRACTINT), and you know the magnification factor of the zoom image, you can determine the size of the original fractal.
For example, if you zoom into the Mandelbrot to a magnification of 2e+26, the original Mandelbrot is about ten billion (1e+10) light-years across - about the size of the known observable Universe.
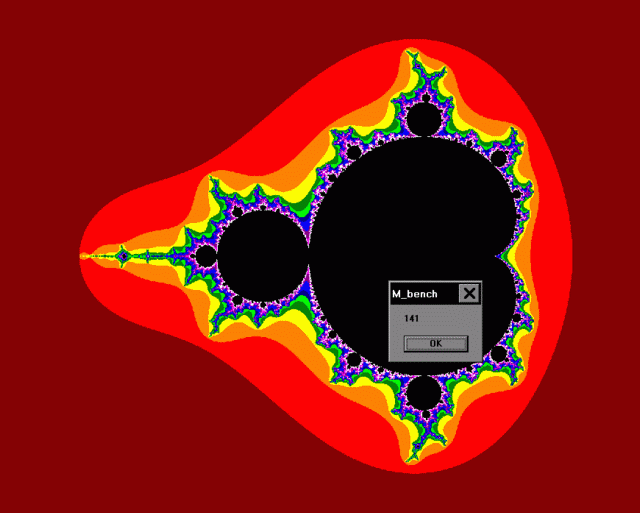
The Mandelbrot Benchmark program draws a default Mandelbrot. When done, the system bell sounds and a message box appears with a number. And that is the number of seconds it took to do. You can use this to test system performance, the effect of hardware upgrades, or comparing systems. This is a Win32 benchmark, and will not necessarily tell you anything about DOS performance, like when using FRACTINT. A good system now should give you 64 sec or thereabouts.
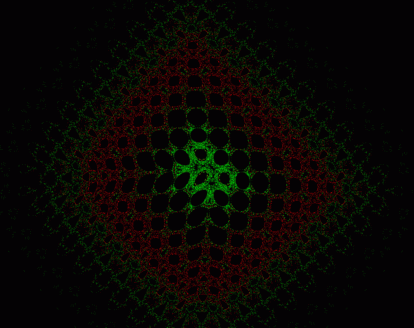
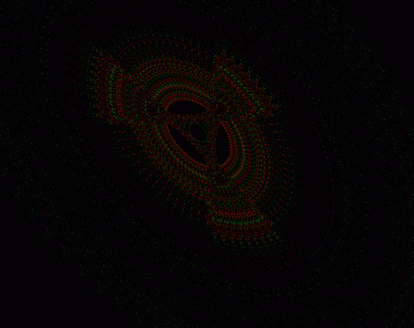
This Strange Attractors program (SAX25) graphs an infinite number of these images, some examples shown below. It is a Multi-function Grapher/Plotter for Strange Attractors.
You can input parameters or let the program pick random numbers. Images can be saved in full size BMP format. A number of other cute mathematical tricks
and functions also, as well as an autorun "screensaver" mode. This is the current version of my "flagship" program, which initiated my fractal websites
and the UFVP. To my knowledge, this is the only program out there that does these things specifically.
Actually, they are not "images" until you stop the
program amd save them. These graphs are dynamic - constantly growing and changing - forever.


The Butterfly program plots 2 Strange Attractors (red and green) simultaneously on top of each other. Similar to the Lorenz Twins program above, you can slightly alter the initial
parameters of one of them and see another graphical demonstration of the famous "chaos", or "butterfly effect". The red and green of the two graphs are easily seen, and where the pixels overlap you see yellow. This is another variation
of the SAX25 program; the graphs are full screen size, it may be difficult to see in these small pictures here. Amazing differences are seen for very small changes in input parameters, a true demonstration of the
"butterfly effect".
